Inside the Data Streams: How Real-Time Odds Adjustments Influence Bettor Behavior Patterns Nationwide
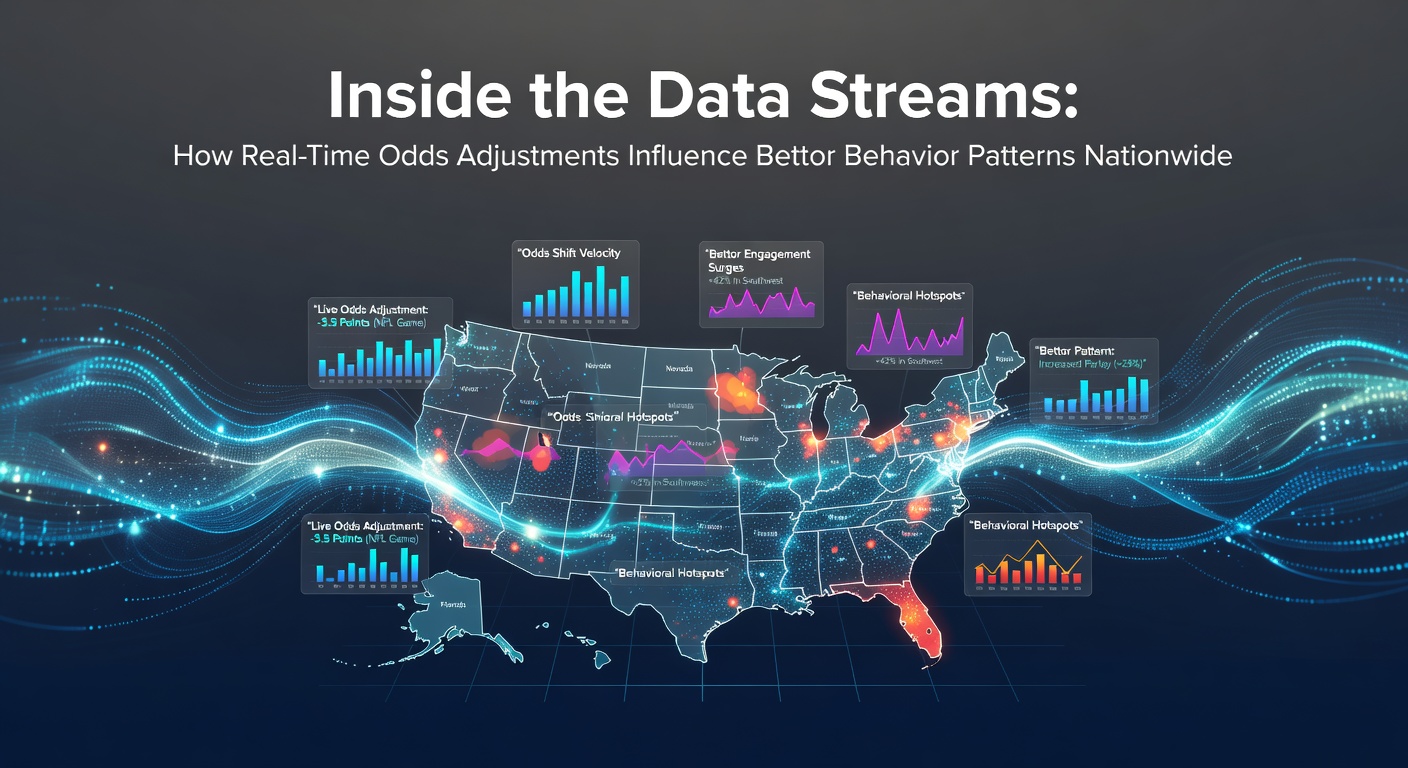
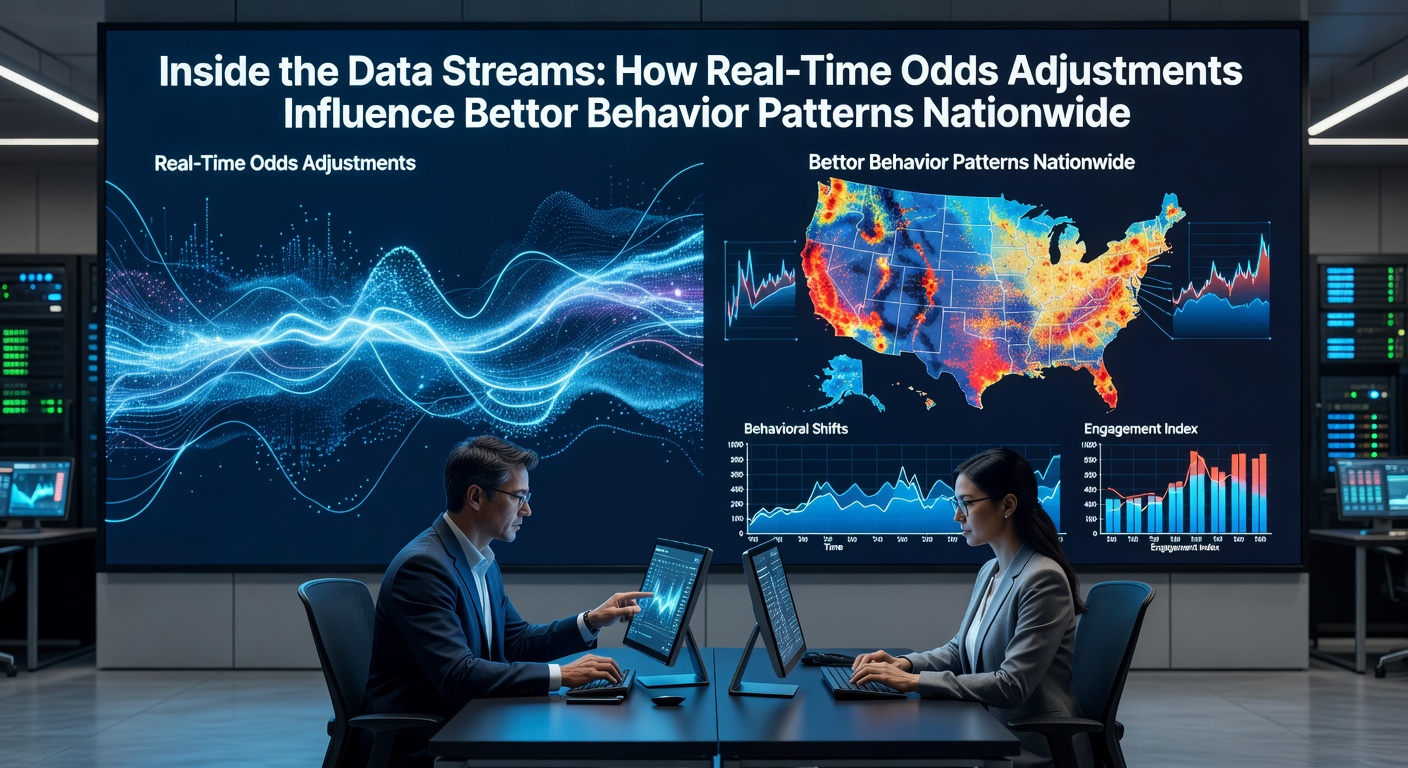
Real-time odds adjustments operate through continuous data streams that process betting volume, player injuries, weather conditions, and market movements within seconds, and these shifts reshape how bettors across the United States place wagers on a daily basis. Algorithms at licensed sportsbooks monitor incoming bets in aggregate while they recalibrate lines to balance risk exposure, and this process creates visible changes that prompt immediate reactions from users monitoring multiple platforms simultaneously.
Data Streams Fueling Instant Adjustments
Operators feed live information from official league sources, news wires, and proprietary tracking systems into centralized models that update probabilities without human intervention in most cases. When heavy action arrives on one side of a matchup, the line moves to encourage bets on the opposing side, and this mechanism keeps the bookmaker's exposure within acceptable limits. Bettors who notice these movements often accelerate their decisions or switch to alternative markets, and patterns emerge consistently from state to state where sports wagering has expanded since legalization began in 2018.
Studies tracking timestamped bet data show that line changes of more than a half-point in football or a run in baseball correlate with spikes in new wagers placed within the following two minutes. Observers note that mobile users react faster than desktop users because push notifications deliver updates directly to handheld devices, and this speed difference appears in aggregated session logs from operators serving multiple regions.
Regional Behavior Patterns Across Legal Markets
In states with mature markets such as New Jersey and Pennsylvania, bettors demonstrate higher rates of hedging after seeing odds tighten, whereas newer jurisdictions like North Carolina exhibit more aggressive chasing behavior following initial line drops. Data compiled through May 2026 indicates that markets opened within the past twelve months record elevated activity in the first hour after major adjustments compared with established ones. Researchers analyzing anonymized transaction records have identified that users in rural areas tend to follow sharp line moves more closely than urban bettors, possibly because they maintain fewer open positions and focus on single-game decisions.
One analysis of betting data revealed that when a moneyline shifts by 20 points or more in basketball, repeat users increase their average stake size by roughly 15 percent on the next wager, while first-time bettors in that session often reduce stakes or exit the market entirely. These responses vary by sport because baseball and hockey lines adjust more frequently due to pitching changes and goalie rotations, and football markets experience larger swings around injury reports released during the week.
Psychological Triggers and Timing Effects
Real-time adjustments serve as external signals that influence perceived value, and many users interpret rapid movement as confirmation of their initial lean. When lines move against a popular side, some bettors double down before further shifts occur, while others wait for stabilization and place smaller corrective bets later. Transaction records indicate that the majority of in-game wagers occur within three minutes of a visible odds change, and this clustering holds across both major and minor sports.
Operators report that parlay and teaser construction rates climb immediately after correlated lines adjust in the same direction, because users attempt to lock in perceived advantages across multiple legs before additional corrections arrive. Those who've examined session replay data find that evening hours produce the strongest reaction clusters, coinciding with national television broadcasts that drive simultaneous viewership and betting interest.
Industry Responses and Platform Adaptations
Sportsbooks have introduced tools that display recent line movement history alongside current odds, and these features allow users to see the direction and magnitude of adjustments over the preceding thirty minutes. Some platforms now offer alerts when specific thresholds are crossed, and adoption of these notifications has grown steadily through spring 2026 according to figures released by the American Gaming Association. The availability of such information changes the sequence of decisions because bettors can compare movements across competing books and select the most favorable timing for entry.
Regulatory filings from several state gaming commissions document increased scrutiny of automated adjustment systems, particularly regarding transparency for consumers who rely on displayed lines. Training programs for responsible gaming staff now include modules on recognizing behavioral responses to rapid odds shifts, and these initiatives aim to identify patterns that might indicate heightened risk for individual accounts.
Future Developments in Data Integration
Advances in sensor technology and faster data pipelines are expected to shorten the lag between on-field events and odds recalibration even further, and early tests in controlled environments show reaction times dropping below one second for certain prop markets. Bettors who maintain multiple accounts across state-licensed operators already exploit small timing differences between platforms, and this practice appears in network traffic patterns during high-volume events. Continued expansion into additional states will likely amplify nationwide variations in how quickly and aggressively users respond to the same underlying data streams.
Conclusion
Real-time odds adjustments form a core component of modern sports wagering infrastructure, and the resulting behavioral patterns reflect both technological capabilities and regional differences in market maturity. As data transmission speeds increase and more states authorize legal betting, the interplay between algorithmic line movement and bettor response will continue to evolve, shaping activity levels and decision timing across the country.