How Stadium Attendance Data Refines In-Game Betting Options at Regional Operators
Written by Devon Müller · Aug 23, 2026

How Stadium Attendance Data Refines In-Game Betting Options at Regional Operators
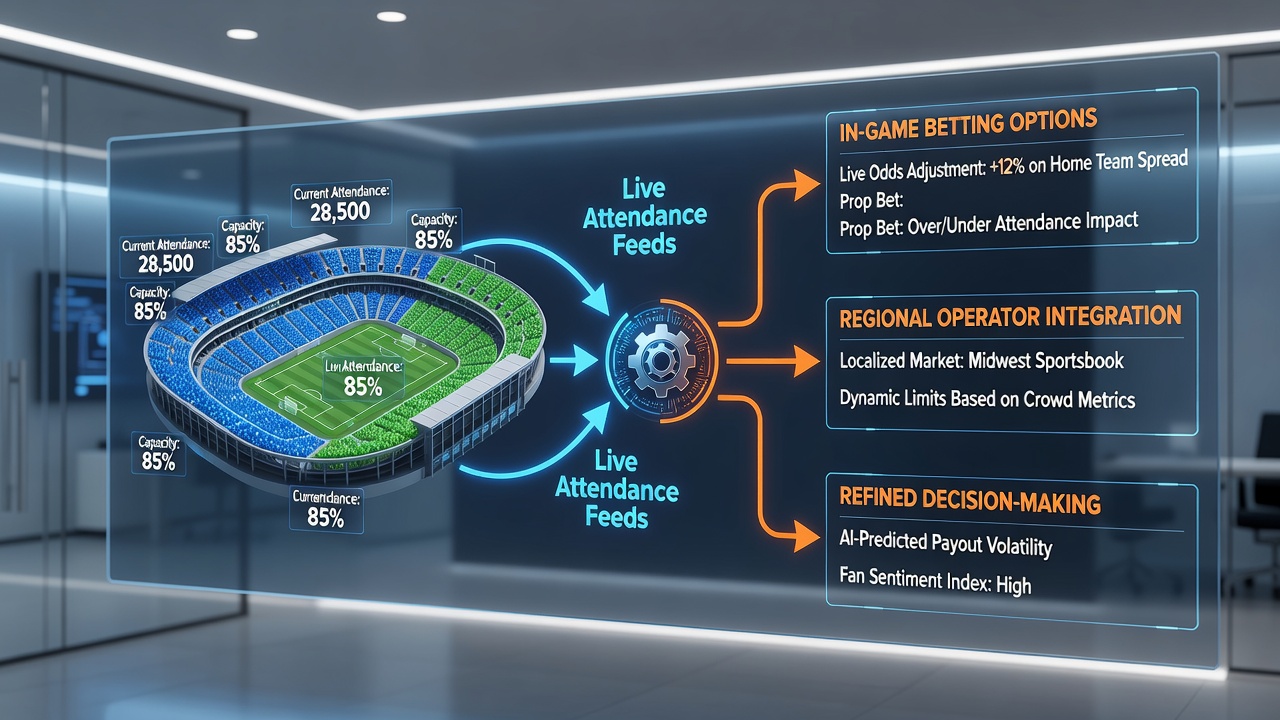
Stadium attendance figures feed directly into live betting engines at regional operators, where operators adjust in-game markets based on real-time crowd metrics that influence player performance and game dynamics. Regional operators collect turnstile counts, mobile app check-ins, and sensor data from venues to calibrate odds on props such as player energy levels, team momentum shifts, and weather-adjusted scoring probabilities during ongoing matches.
Data Streams from Venues
Operators pull attendance numbers from multiple inputs that update every few minutes, including electronic ticket scans, Wi-Fi connection logs, and closed-circuit camera counts that track section occupancy. These figures combine with external variables such as temperature readings and precipitation levels when events occur outdoors, allowing systems to recalibrate live lines on totals and player-specific wagers. Research from the University of Nevada, Las Vegas shows that crowd density above 85 percent capacity correlates with measurable changes in home-team scoring rates across professional basketball and football contests.
Regional operators integrate these venue feeds through application programming interfaces that connect stadium management software directly to their risk management platforms. When attendance spikes unexpectedly during a second-half surge, algorithms widen or tighten spreads on live team totals and individual rebound or tackle props within seconds of the updated data arriving.
Adjustments to In-Game Markets
Attendance data refines prop bets by signaling shifts in player stamina and crowd-driven motivation. Operators monitor section-by-section occupancy to detect when certain fan groups increase noise levels that historically disrupt visiting team communication, which in turn affects live odds on penalty calls or turnover margins. In August 2026, several Midwest operators reported using such inputs to refine basketball prop markets during summer league exhibitions where venue capacity fluctuated due to local weather events.
Systems also apply attendance patterns to weather-sensitive sports. Heavy rain combined with low attendance at open-air stadiums prompts operators to adjust over/under lines on passing yards or goal totals because reduced crowd support alters coaching decisions on aggressive play-calling. Data from these adjustments flows into regional risk engines that balance liability across correlated live markets.
Regional Operator Implementation
Smaller operators serving specific states or provinces gain an edge by focusing on local venue data that national platforms overlook. They cross-reference attendance spikes with historical performance records for teams that play in front of familiar crowds, creating customized live options unavailable at larger competitors. This approach appears in markets where state regulations require operators to maintain localized risk controls tied to venue-specific information.
Operators in regulated jurisdictions such as those overseen by the New Jersey Division of Gaming Enforcement incorporate attendance thresholds into their responsible gaming protocols, pausing certain high-velocity markets when venue data indicates unusually sparse crowds that might signal external factors affecting game integrity. These protocols operate alongside standard geolocation checks that already restrict betting access to approved regions.
Technical Integration Patterns
Betting platforms connect venue data through secure feeds that update at intervals ranging from 30 seconds to two minutes depending on the sport and regulatory requirements. Machine learning models trained on past seasons identify which attendance ranges produce statistically significant deviations in expected outcomes, then apply those models to current games. Regional operators test these models against smaller sample sizes drawn from nearby colleges and minor leagues before deploying them on major professional events.
Partnerships with stadium technology providers allow operators to receive anonymized crowd movement data that refines timing of in-game market releases. When attendance data shows rapid influxes into premium seating areas near the field, systems sometimes accelerate release of player prop markets tied to visibility and pressure on visiting athletes. Reports from the American Gaming Association document how such venue-linked adjustments have expanded the range of live options offered during regular season play across multiple states.
Regulatory Context and August 2026 Trends
State gaming commissions require operators to maintain audit trails that link attendance inputs to specific odds changes, ensuring transparency when regulators review market integrity. In August 2026, several operators expanded these data partnerships to include minor league baseball venues where attendance swings are more pronounced due to promotional events and weather variability. The resulting refinements produced narrower live spreads on run totals and strikeout props during evening games with fluctuating gate counts.
Operators also track how attendance patterns interact with television viewership metrics to avoid double-counting correlated signals. Regional systems isolate venue-specific effects by comparing games with similar broadcast audiences but different physical crowd sizes, isolating the impact of in-stadium energy on officiating and player decision-making.
Conclusion
Stadium attendance data continues to supply regional operators with granular inputs that sharpen the precision of in-game betting markets across multiple sports and jurisdictions. These systems rely on continuous venue feeds, regulatory compliance frameworks, and localized modeling to deliver options that reflect real-time conditions at each event site. As operators refine their data pipelines through 2026 and beyond, attendance metrics remain a core component of live odds calibration at the regional level.